In the previous article I wrote about Kafka broker metrics and why collecting them is harder than it should be.
The short version was: Kafka does not have one metric system.
It has the newer Kafka Metrics SPI, configured with metric.reporters, and the older Yammer/Coda Hale registry, configured with kafka.metrics.reporters. Some important broker metrics live in one system, some in the other, and most real-world monitoring setups still go through JMX, regular expressions, Prometheus mappings, and dashboards that may or may not match the exported names.
That was the reason for creating monedula-metrics-reporter: a Kafka plugin that exports metrics directly over OTLP to an OpenTelemetry Collector and handles both Kafka metric registries with one configuration.
But there was still one missing part.
Broker metrics tell us a lot about the cluster, but they do not fully explain what is happening inside client applications.
A broker can tell us that Produce requests are slow. It can tell us that Fetch requests are slow. It can tell us about request queues, network processors, under-replicated partitions, failed requests, and many other things.
But sometimes the real question is not only:
What is happening on the broker?
It is also:
What is happening inside the producer or consumer?
Is the producer batching efficiently? Is it throttled? Is the consumer polling regularly? Is it spending time in rebalances? Is one application behaving differently from another one?
Traditionally, answering these questions meant instrumenting every client application separately. In Java, that often meant JMX again. In other languages, it depended on the client library, the framework, and whatever observability setup the team had.
And in larger organisations this becomes a very familiar problem: the Kafka team owns the cluster, but the client applications are owned by many different teams. So when something goes wrong, the cluster operator often does not have the client-side metrics they need, and getting them requires coordination, code changes, redeployments, or at least restarts.
This is exactly the problem that KIP-714 tries to solve.
The idea behind KIP-714
KIP-714 adds a broker-driven way to collect metrics from Kafka clients.
Instead of every application team configuring its own metrics exporter, the Kafka cluster can define client metric subscriptions. A subscription says which client metrics should be collected and how often clients should push them.
The clients then push their metrics to the brokers using the Kafka protocol. The payload itself is OTLP, so the broker-side plugin can forward it to an OpenTelemetry Collector, a time-series database, or any other observability backend.
The important part is the direction of control.
The cluster operator decides what to collect.
Clients that support KIP-714 can receive the subscription and push the requested metrics. The application does not need to expose JMX. It does not need a sidecar exporter. It does not need a custom Prometheus endpoint.
There are still two conditions:
- The broker must have a client telemetry plugin configured.
- At least one client metrics subscription must exist.
Without a subscription, clients may support the protocol, but they will not push metrics.
This is a good design. Client metrics are not collected accidentally. The operator must explicitly enable the collection on the cluster side.
One important detail: not every client sends the same metrics
KIP-714 creates a common mechanism for collecting client metrics, but it does not magically make every Kafka client expose the same metric set.
The metrics you get depend on the client library.
The Java client currently sends the richest set of metrics. This is not surprising: the Java client is the reference implementation, it has a very mature internal metrics registry, and many Kafka metrics were designed there first.
Other clients may expose a smaller set. librdkafka-based clients, such as clients used by Python, Go, .NET, and Node wrappers, can still participate in KIP-714, but the available metrics are not necessarily identical to what the Java client sends.
So the mental model should be:
KIP-714 standardizes how client metrics are requested and transported. The actual metric set still depends on the client implementation.
This matters when building dashboards.
Some panels can be based on common metrics and should work across different client libraries. Other panels are only meaningful when the client actually sends the richer metric set. In practice, the Java client gives the most complete observability story today.
Why add this to monedula-metrics-reporter?
At first, monedula-metrics-reporter was about broker metrics.
It handled the Kafka SPI registry. It handled the Yammer registry. It exported both over OTLP. It added broker identity as resource attributes. It shipped with Grafana dashboards matching the emitted metrics.
But once KIP-714 exists, there is a very natural next step:
If the plugin already runs inside the broker and already exports OTLP to the collector, it should also handle client-pushed metrics.
Otherwise, Kafka monitoring would still be split.
You would have one path for broker SPI metrics, another path for Yammer metrics, and yet another plugin or component for KIP-714 client telemetry.
That would work, but it would defeat the whole idea of simplifying the Kafka metrics stack.
So the new version of monedula-metrics-reporter now handles three metric sources:
- Kafka Metrics SPI
- Yammer / Coda Hale broker metrics
- KIP-714 client-pushed telemetry
The goal is simple: one plugin, one collector pipeline, one set of dashboards.
Client metrics are forwarded through the same OpenTelemetry path as the broker metrics. They can carry the same broker labels, such as kafka_cluster_id and kafka_node_id, and they can also be enriched with the client_id, so metrics from different applications do not merge into one anonymous stream.
That last point is very important.
If two producers push the same metric name, we need to know which producer is which. By default, the reporter adds the client id as a label. More sensitive or high-cardinality labels, such as client instance id, principal, or client address, are opt-in.
How it works
The broker-side part is implemented through Kafka’s ClientTelemetry interface.
When a KIP-714-capable client pushes telemetry to a broker, the plugin receives the OTLP payload. The request-handler thread does only minimal work: it copies the payload onto a bounded in-memory queue. Then a daemon thread reads from that queue, converts the payload into OpenTelemetry SDK metric data, enriches it with labels, and exports it using a dedicated metric exporter.
This is the same design principle as the rest of the reporter:
Kafka must never be blocked by the observability pipeline.
If the collector is unavailable, slow, or misconfigured, Kafka should continue serving traffic. The telemetry batch can be dropped. Kafka latency should not depend on the monitoring backend.
The client telemetry receiver has its own self-monitoring metrics too:
monedula_reporter_clienttelemetry_received_total
monedula_reporter_clienttelemetry_forwarded_total
monedula_reporter_clienttelemetry_dropped_total
monedula_reporter_clienttelemetry_unsupported_metrics_dropped_total
monedula_reporter_clienttelemetry_queue_depth
So if client telemetry stops flowing, there is something to look at before guessing.
Installation
The artifact is published in Maven Central, so there is no need to build it manually.
For version 0.10.0, download the JAR from Maven Central:
curl -L \
  -o monedula-metrics-reporter-0.10.0.jar \
  https://repo1.maven.org/maven2/dev/monedula/monedula-metrics-reporter/0.10.0/monedula-metrics-reporter-0.10.0.jar
Then copy it to Kafka’s classpath:
cp monedula-metrics-reporter-0.10.0.jar $KAFKA_HOME/libs/After that, configure the broker:
metric.reporters=dev.monedula.metricsreporter.OtlpMetricReporter

otlp.metric.reporter.endpoint=http://otel-collector:4317
otlp.metric.reporter.transport=grpc
This enables the reporter for Kafka SPI metrics, Yammer broker metrics, and client telemetry.
Client telemetry is enabled by default on brokers:
otlp.metric.reporter.client.telemetry.enabled=trueYou can disable it explicitly:
otlp.metric.reporter.client.telemetry.enabled=falseWhen disabled, the broker will not advertise the telemetry capability to clients.
Collector configuration
A minimal OpenTelemetry Collector configuration can receive OTLP from the reporter and expose metrics for Prometheus:
receivers:
  otlp:
    protocols:
      grpc:
        endpoint: "0.0.0.0:4317"
      http:
        endpoint: "0.0.0.0:4318"

exporters:
  prometheus:
    endpoint: "0.0.0.0:8889"
    resource_to_telemetry_conversion:
      enabled: true

service:
  pipelines:
    metrics:
      receivers: [otlp]
      exporters: [prometheus]
The resource_to_telemetry_conversion setting is important when using Prometheus. It promotes OpenTelemetry resource attributes to Prometheus labels.
Without it, labels such as kafka_cluster_id, kafka_node_id, and client_id may not appear where you expect them.
Prometheus can then scrape the collector:
scrape_configs:
  - job_name: otel-collector
    static_configs:
      - targets: ["otel-collector:8889"]
The important part: client metric subscriptions
Installing the plugin is not enough.
This is the part that is easy to miss with KIP-714.
Clients push metrics only when there is a client metrics subscription configured on the cluster.
For example:
kafka-client-metrics.sh \
  --bootstrap-server broker:9092 \
  --alter \
  --name all-clients \
  --metrics "*" \
  --interval 5000
This creates or updates a subscription named all-clients, asks for all available client metrics, and sets the push interval to 5 seconds.
For production usage, collecting everything may be too much. You can also subscribe only to selected metric prefixes.
For example, you may start with the standard Kafka client metrics:
kafka-client-metrics.sh \
  --bootstrap-server broker:9092 \
  --alter \
  --name standard-client-metrics \
  --metrics "org.apache.kafka." \
  --interval 10000
The exact subscription strategy depends on what you want to observe and how much metric volume you are comfortable with.
The important thing is that the subscription lives on the broker side. This makes it possible for the Kafka operator to decide what should be collected without asking every application team to change their monitoring setup.
What about client configuration?
For clients that support KIP-714, metrics push is usually enabled by default.
Still, you can make it explicit:
enable.metrics.push=trueFor Java clients, this is part of the Kafka client configuration.
For librdkafka-based clients, such as confluent-kafka-python, the same idea applies. For example:
Producer({
    "bootstrap.servers": "broker:9092",
    "client.id": "orders-producer",
    "enable.metrics.push": True,
})
And for a consumer:
Consumer({
    "bootstrap.servers": "broker:9092",
    "group.id": "orders-consumer-group",
    "client.id": "orders-consumer",
    "enable.metrics.push": True,
})
The client.id is worth setting deliberately.
The reporter adds it to forwarded client metrics by default, so dashboards can separate metrics by application. Without a meaningful client id, you will still get metrics, but they will be much harder to use during troubleshooting.
Enrichment options
By default, forwarded client metrics are enriched with broker identity and client id:
otlp.metric.reporter.client.telemetry.enrich.broker=true
otlp.metric.reporter.client.telemetry.enrich.client.id=true
This means client metrics can be grouped by cluster, broker, and application.
There are also optional enrichments:
otlp.metric.reporter.client.telemetry.enrich.client.instance.id=true
otlp.metric.reporter.client.telemetry.enrich.client.identity=true
The client instance id is useful when you want to distinguish individual running client instances, but it is high-cardinality.
Client identity adds principal and client address. This can be very useful in controlled environments, but it may also contain sensitive information, so it is disabled by default.
In short: start with broker labels and client id. Enable the rest only when you really need it.
Quickstart
The repository contains a quickstart stack with Kafka, the OpenTelemetry Collector, Prometheus, and Grafana.
Start the quickstart:
cd quickstart
docker compose up -d
The demo service creates a KIP-714 client metrics subscription and starts producer and consumer traffic. So after the stack is up, both broker dashboards and client dashboards should start receiving data.
Grafana is available at:
http://localhost:3000Prometheus is available at:
http://localhost:9090The quickstart creates the subscription with:
kafka-client-metrics.sh \
  --bootstrap-server kafka1:9092 \
  --alter \
  --name quickstart-clients \
  --metrics "*" \
  --interval 5000
That is intentionally simple: collect everything, push every 5 seconds, and make the dashboards come alive quickly.
For real environments, I would usually start more carefully. First collect the standard metrics, validate the volume, and then add more metrics if needed.
Java clients vs other clients
One interesting thing about KIP-714 is that it creates a common mechanism, but not every client library exposes the same depth of metrics.
The Java client sends the richest set of metrics. It can push many metrics from its internal registry, including richer producer and consumer details: batching, buffer usage, request timing, topic-level breakdowns, consumer lag and lead, and other Java-client-specific signals.
Other client libraries may send a smaller set.
That does not mean KIP-714 is useful only for Java clients. It is still very useful to have a common, broker-driven collection path for all clients that support it. But when you look at dashboards, you should remember that missing panels do not always mean something is broken.
Sometimes the metric simply does not exist in this client library.
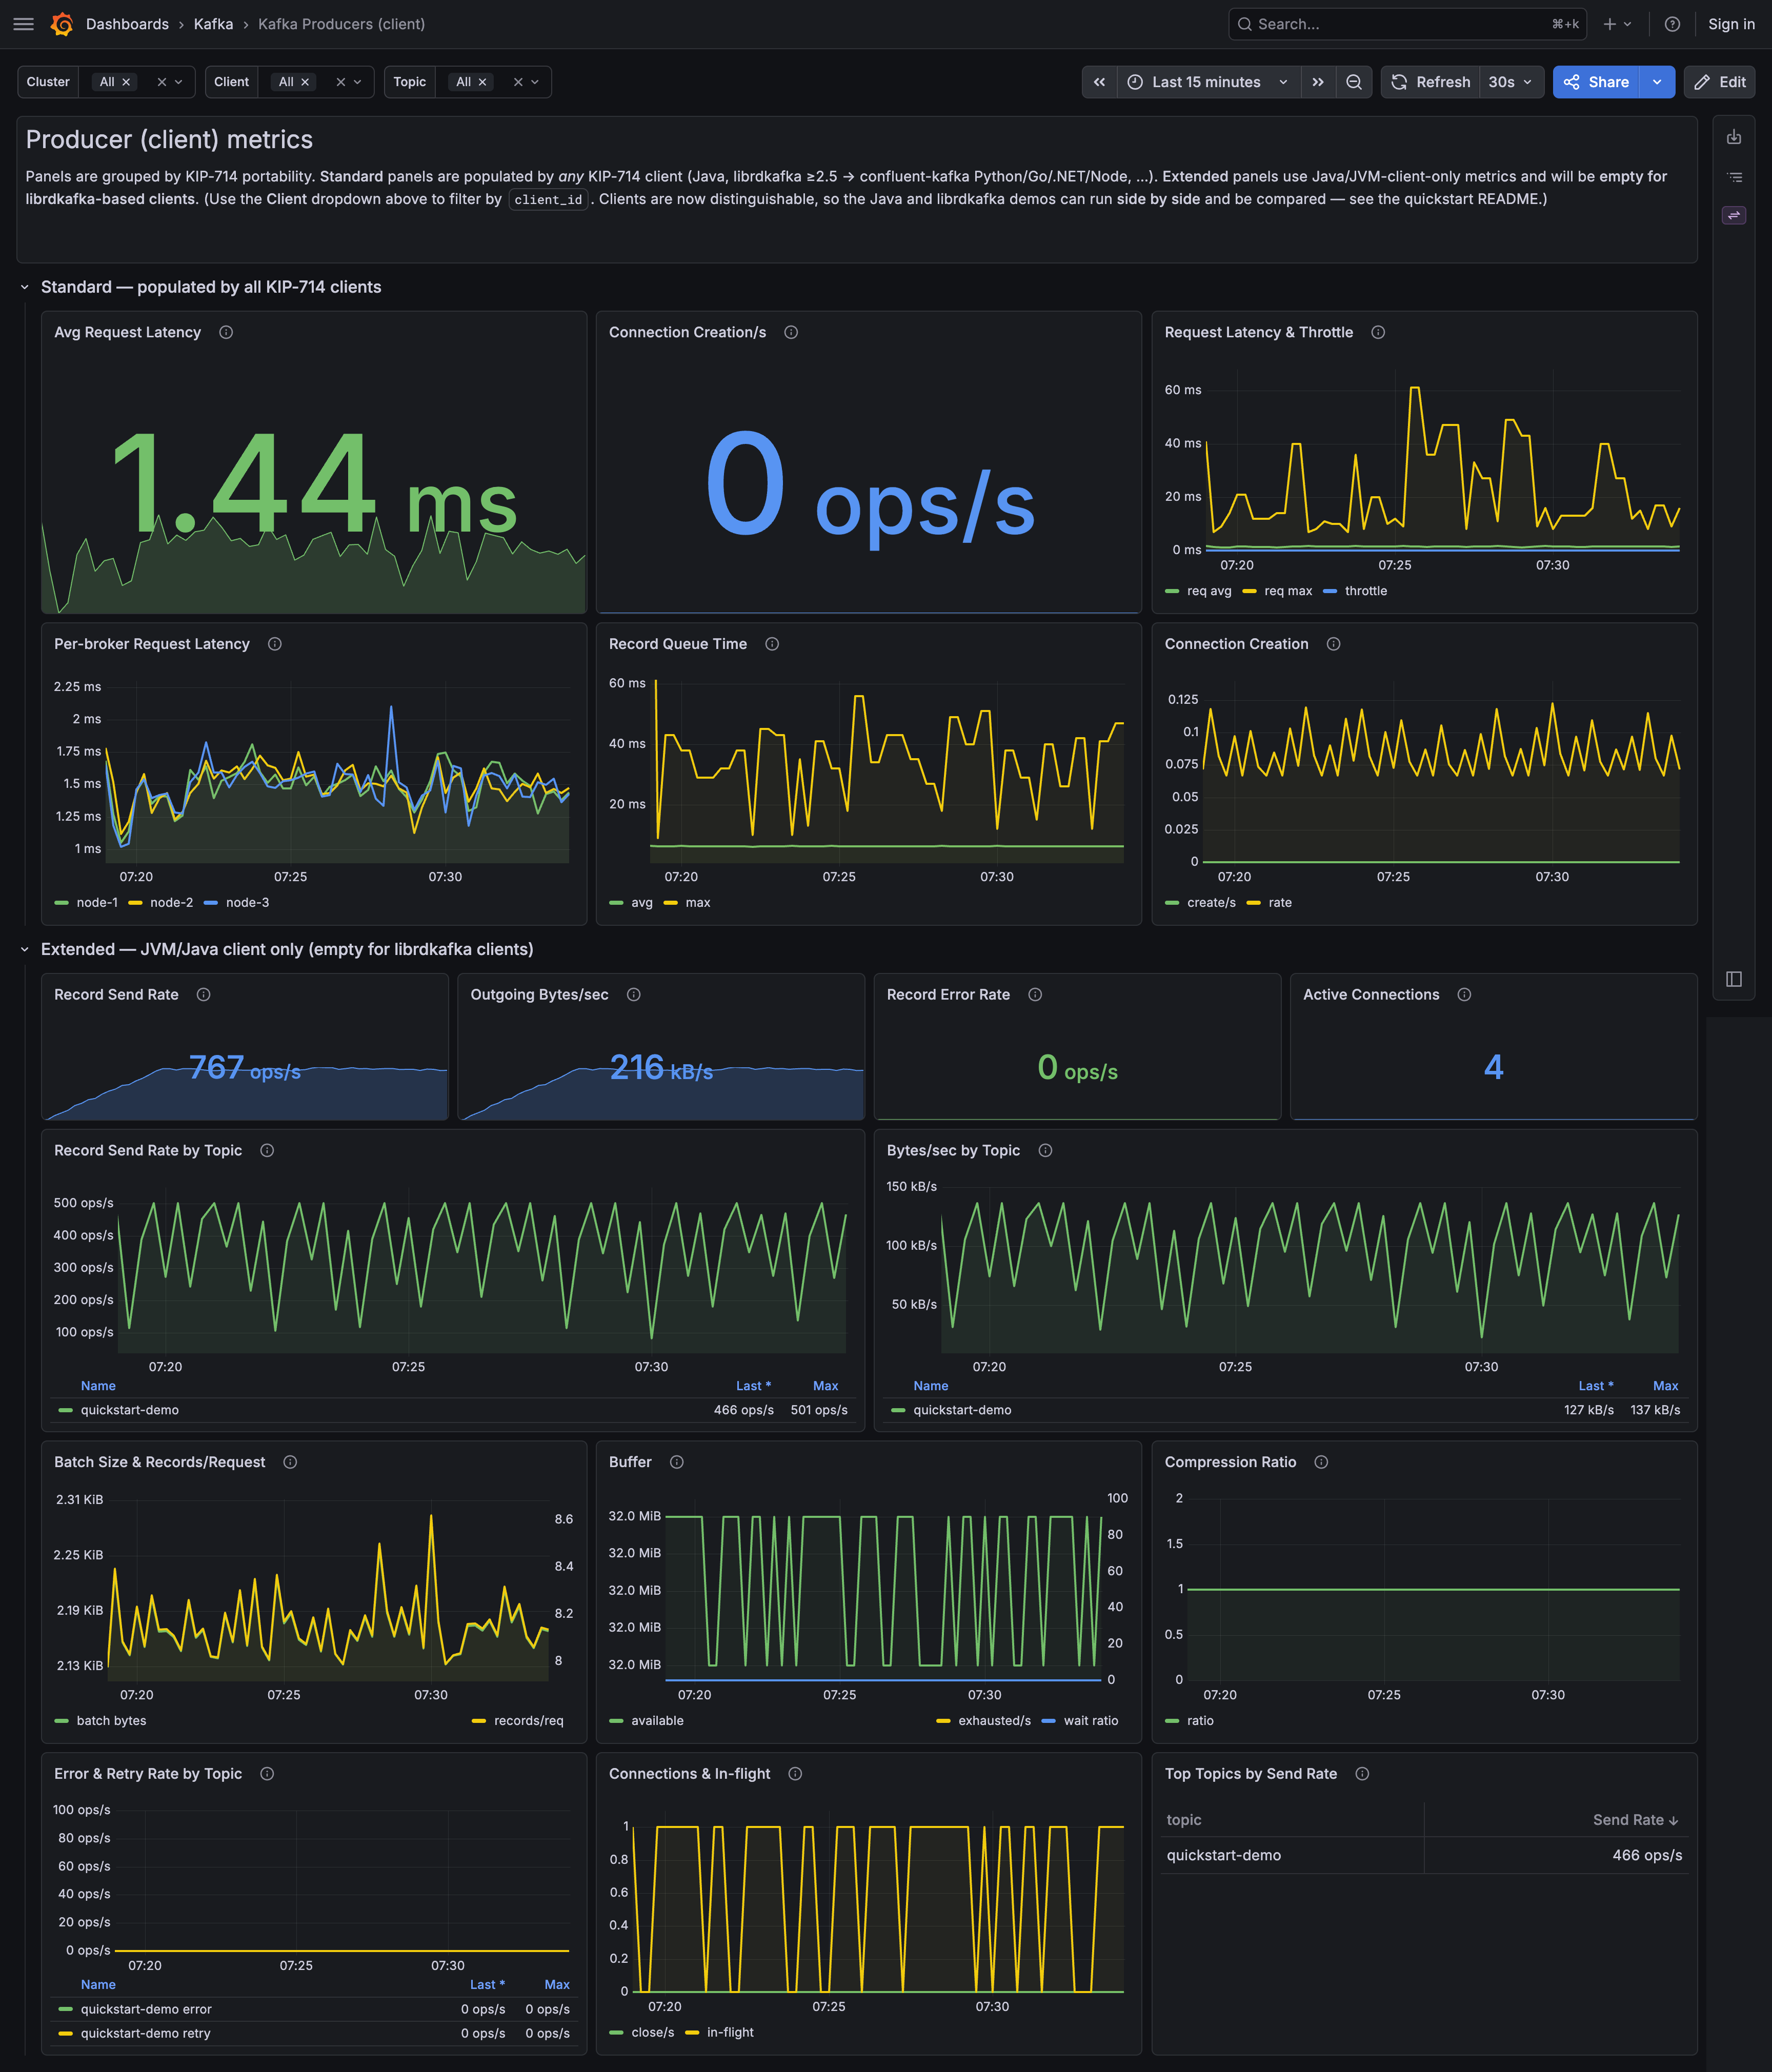
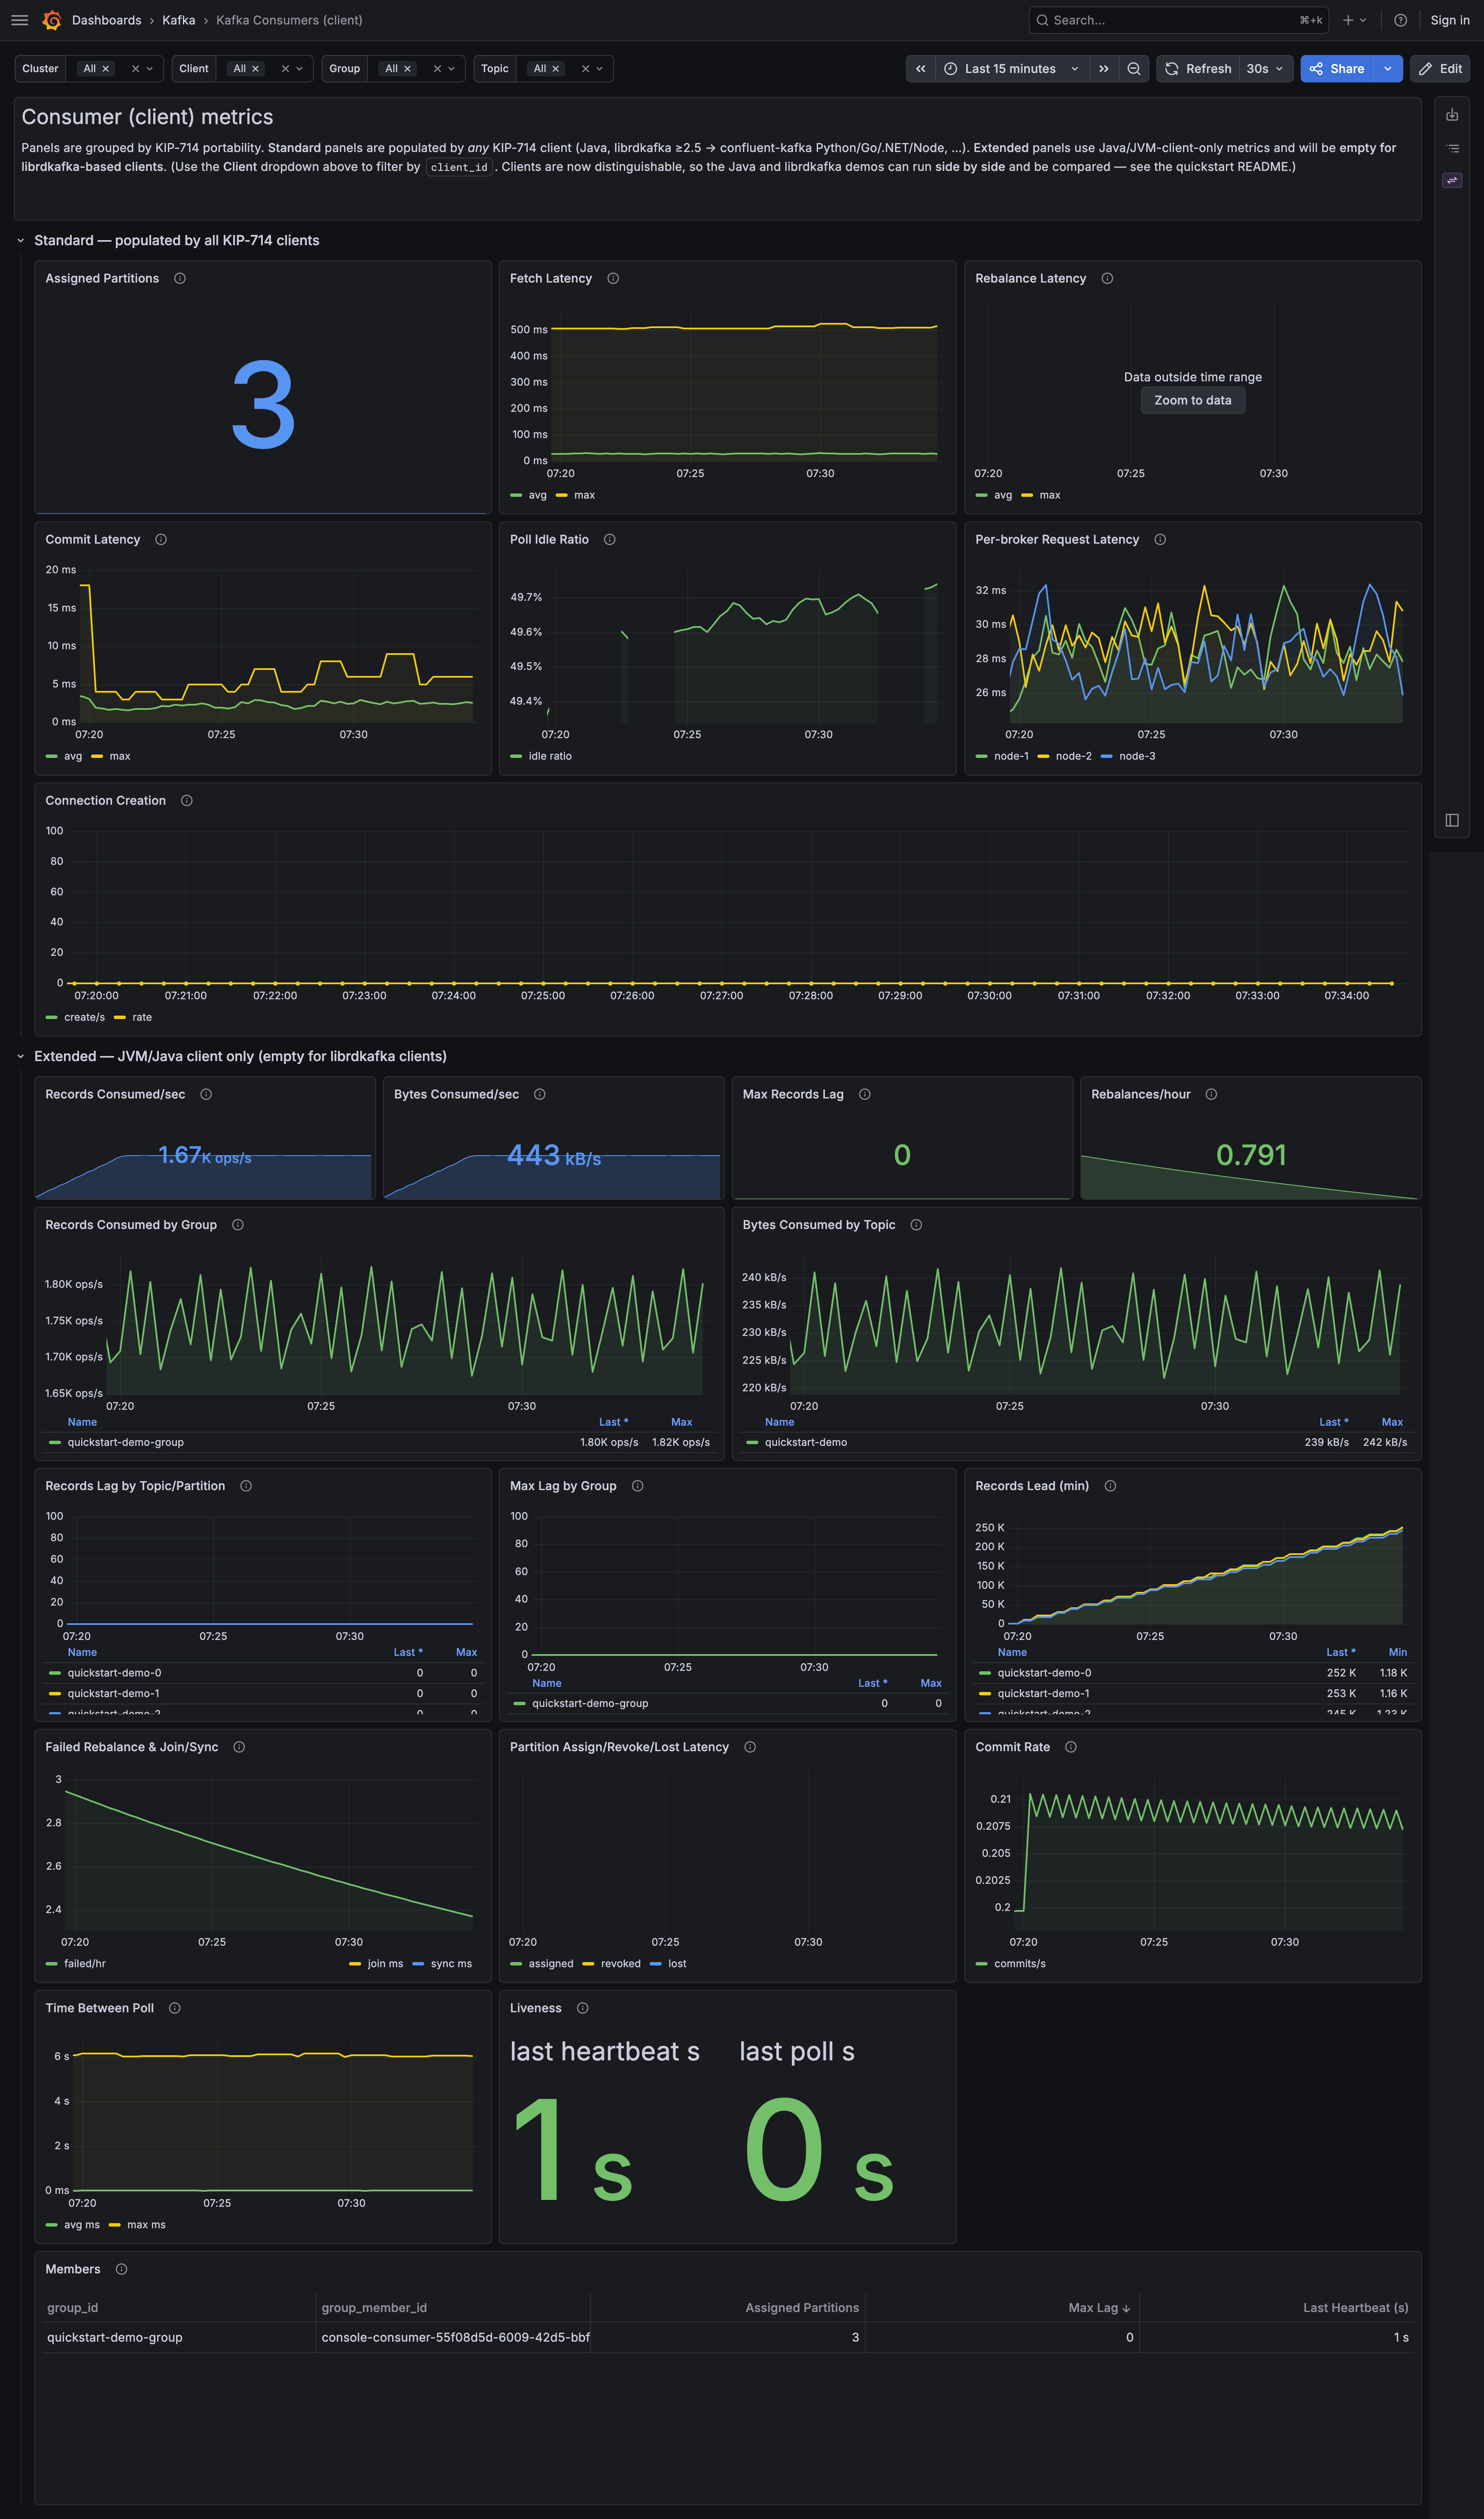
This is why the new Grafana dashboards are split into two parts:
- Standard panels
- Extended panels
The standard panels should work for every KIP-714-compliant client that exposes the relevant common metrics.
The extended panels are mainly useful for the Java client, because the Java client currently provides the richest metric set.
This split is intentional. I do not want a dashboard that looks broken just because a non-Java client does not expose Java-specific metrics. It is better to make the boundary visible.
New dashboards
The new version adds two client-focused dashboards:
- Kafka Producers (client)
- Kafka Consumers (client)
The producer dashboard focuses on the client-side view of producing records: request latency, throttling, queueing, batching, errors, and throughput.
The consumer dashboard focuses on the client-side view of consuming records: fetch latency, commit rate, poll behavior, rebalance-related signals, assignment changes, and consumer-side lag/lead where available.
Both dashboards include filters for cluster and client id. Where the metric set supports it, they also include topic or group-level drill-downs.
There is one thing I really like about this setup: the same Grafana folder can now show both sides of the story.
Broker dashboards answer:
Is the cluster healthy?
Client dashboards answer:
How do applications experience the cluster?
And because both come from the same OTLP pipeline, with consistent labels, it becomes much easier to correlate them.
Summary
KIP-714 is a very important step for Kafka observability.
It changes client metrics from something each application team has to expose independently into something the Kafka cluster can request centrally.
monedula-metrics-reporter now supports this model.
It still exports broker metrics from both Kafka metric registries. But now it also receives client-pushed OTLP telemetry from KIP-714 clients and forwards it to the same OpenTelemetry Collector.
So the plugin now covers three sources:
- Kafka SPI metrics
- Yammer broker metrics
- KIP-714 client telemetry
The result is a simpler Kafka monitoring architecture: one plugin on the brokers, one OTLP pipeline, and dashboards that cover both broker-side and client-side behavior.
The code is open source and available on GitHub