monedula-gitops
GitOps for Apache Kafka: topics, access, quotas, schemas, SCRAM users and Confluent RBAC, from a CLI or a Kubernetes operator.
monedula-metrics-reporter v0.10.0, AGPL-3.0
monedula-metrics-reporter runs inside the broker and pushes metrics over OTLP to your collector: both Kafka metric registries, JVM metrics and KIP-714 client telemetry, with broker identity as labels. If the collector goes away, Kafka does not notice.
VERSION=0.10.0
curl -L -o monedula-metrics-reporter-${VERSION}.jar \
https://repo1.maven.org/maven2/dev/monedula/monedula-metrics-reporter/${VERSION}/monedula-metrics-reporter-${VERSION}.jarVERSION=0.10.0
curl -L -o monedula-metrics-reporter-${VERSION}.jar \
https://github.com/monedula-dev/monedula-metrics-reporter/releases/download/v${VERSION}/monedula-metrics-reporter-${VERSION}.jarmetric.reporters=dev.monedula.metricsreporter.OtlpMetricReporter
otlp.metric.reporter.endpoint=http://otel-collector:4317
otlp.metric.reporter.transport=grpccp monedula-metrics-reporter-0.10.0.jar $KAFKA_HOME/libs/# then add the lines above to server.properties# every series carries the broker's cluster and node IDs as resource attributes
Most Kafka metrics take the long way round.
The usual stack attaches a JMX exporter to every broker: it reads Kafka's metrics back out of JMX MBeans, maps them to metric names with rule files, and serves them for a scrape or pushes them on to a collector.
monedula-metrics-reporter plugs into Kafka's own MetricsReporter interface and speaks OTLP to the collector directly.
Metric callbacks only update an in-memory map; all network I/O happens on a daemon thread. There is no retry queue and no unbounded memory, so a slow or missing collector never holds up produce or fetch requests.
Kafka brokers expose metrics through two parallel systems. Several broker signals only register with the legacy Yammer registry, so an SPI-only reporter misses them. This plugin attaches to both with one configuration, and the same JAR runs unchanged on clients.
UnderReplicatedPartitionsOfflinePartitionsCountActiveControllerCountBrokerTopicMetricsKIP-714
On brokers, the plugin also receives the telemetry that KIP-714 clients push, such as client-side request latency and rebalance timings, and forwards it to the same collector. Client series carry the broker's identity and the client id, so they join broker series in PromQL.
kafka_cluster_id, kafka_node_id | on by default |
|---|---|
client_id | on by default |
client_instance_id | opt-in, high cardinality |
| principal and client address | opt-in, personal data |
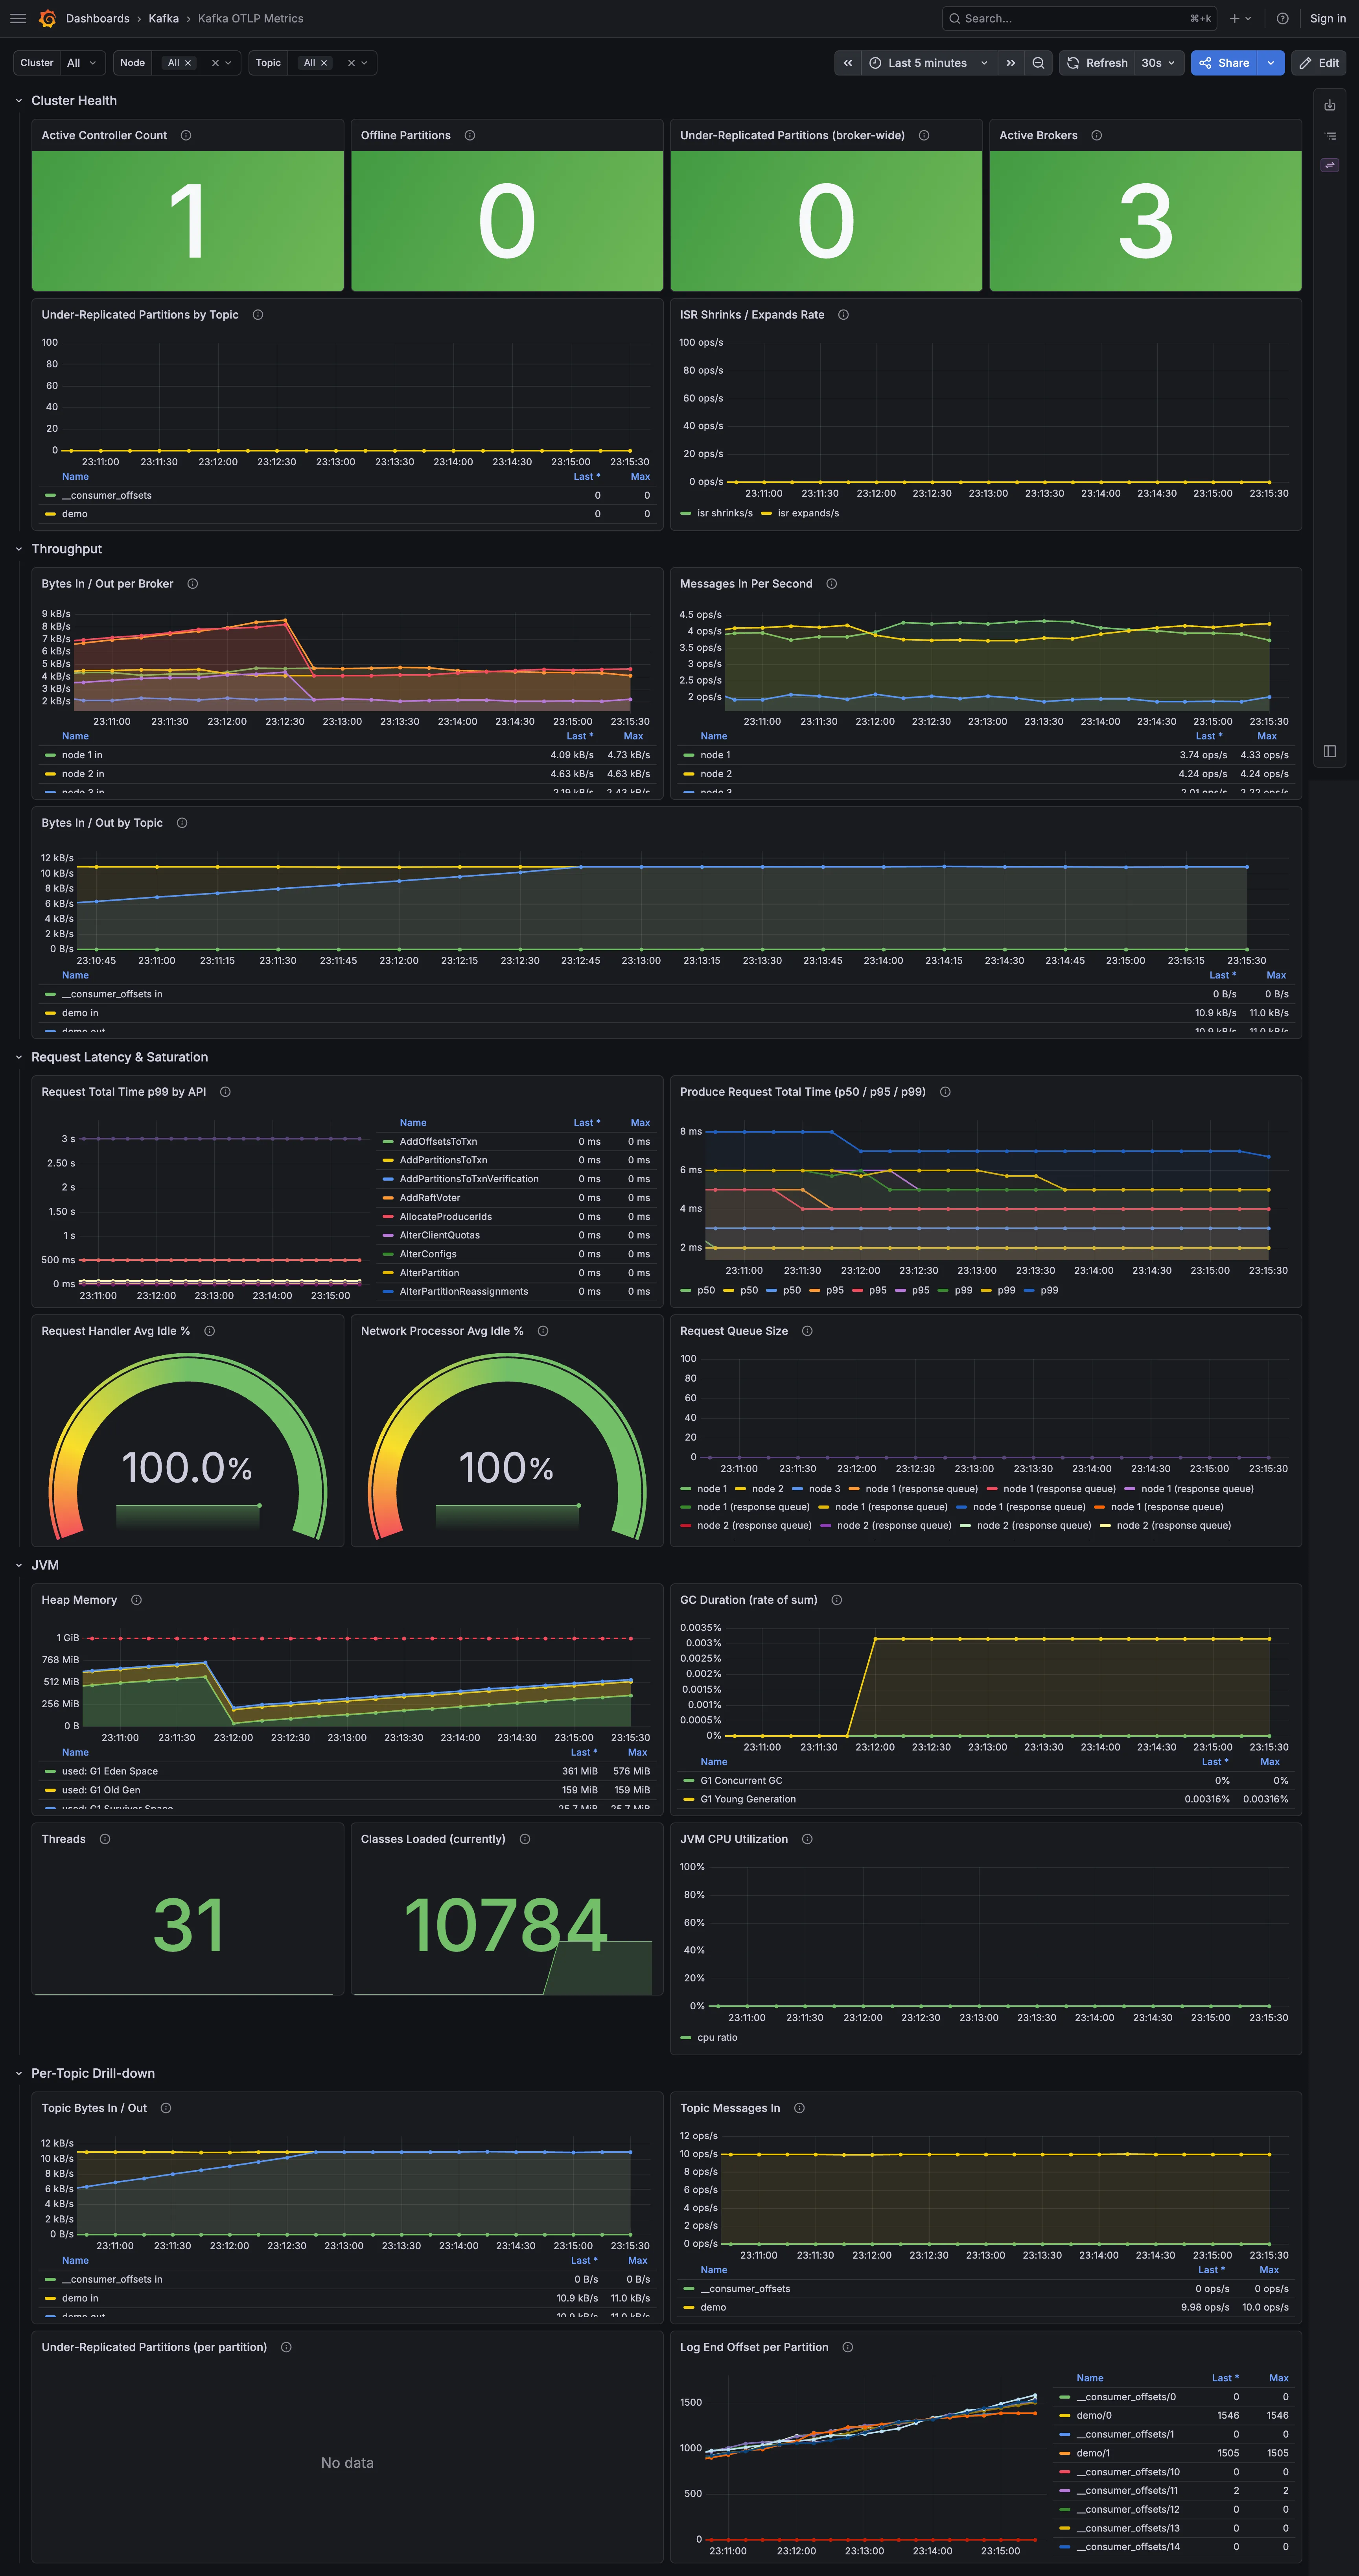
The quickstart starts Kafka, the reporter, an OpenTelemetry Collector, Prometheus and Grafana with Docker Compose, with Grafana dashboards and Prometheus alert rules ready to use.
VERSION=0.10.0
curl -L -o monedula-metrics-reporter-${VERSION}.jar \
https://repo1.maven.org/maven2/dev/monedula/monedula-metrics-reporter/${VERSION}/monedula-metrics-reporter-${VERSION}.jarVERSION=0.10.0
curl -L -o monedula-metrics-reporter-${VERSION}.jar \
https://github.com/monedula-dev/monedula-metrics-reporter/releases/download/v${VERSION}/monedula-metrics-reporter-${VERSION}.jarCoordinates dev.monedula:monedula-metrics-reporter. Each GitHub release also carries the JAR with a CycloneDX SBOM and Sigstore signatures.
We can help you run monedula-metrics-reporter across a large estate, from design to day-to-day operations.
More free tools for Apache Kafka from the same team. About Flock
GitOps for Apache Kafka: topics, access, quotas, schemas, SCRAM users and Confluent RBAC, from a CLI or a Kubernetes operator.
A CLI that converts Apache Kafka ACLs into Confluent RBAC role bindings through a checksummed plan and verifies effective access before any ACL is deleted.
A read-only Go CLI that turns a real Kafka cluster into a shareable Kafka Simulator link, with an MCP server for AI agents.
An interactive, deterministic Apache Kafka simulator in the browser: break a cluster, scrub the timeline and read why it reacted.