Apache Kafka is often explained as a set of concepts: topics, partitions, brokers, producers, consumers, replicas, offsets, leaders, followers, and consumer groups.
That works well at the beginning.
Then the first failure enters the conversation.
A broker goes down. A follower starts lagging. The ISR shrinks. A producer uses acks=all. A consumer keeps reading, but only up to the high watermark. A controller election happens. A region becomes unavailable. Suddenly, the system is no longer a static diagram. It is a timeline of decisions.
And this is where Kafka becomes difficult to teach.
Not because the individual concepts are impossible, but because the interesting behavior only appears when they interact.
That is why we built the Kafka Simulator — a browser-based, deterministic model of Kafka you can break safely and replay step by step. It runs on Apache Kafka 4.3 semantics, needs no backend, and sends no telemetry about your scenarios.
Kafka failures are hard to explain on a whiteboard
Some Kafka questions are easy to ask and surprisingly hard to answer without visualization.
- What happens when replication factor is
3,min.insync.replicasis2, and one broker dies? - What changes when the second broker dies?
- Why can a producer still write after the first failure, but starts receiving
NotEnoughReplicasafter the second? - What exactly does
acks=allwait for? - Why did the high watermark stop advancing?
- Which replica becomes leader after a broker failure?
- What does an unclean leader election actually lose?
- How do you explain the difference between a healthy cluster, a degraded cluster, and a cluster that is still alive but can no longer satisfy its durability guarantees?
These are the moments where a static diagram starts to fall apart.
Kafka is a distributed system. It has time, order, failure, recovery, and trade-offs. The most important lessons are often hidden in transitions: before and after a failure, before and after a rebalance, before and after a controller election, before and after the ISR changes.
A simulator for seeing Kafka move
The goal of the simulator is simple: make Kafka behavior visible.
You can change Kafka settings, run a scenario or build your own cluster, break it, and then inspect what happened step by step. Instead of jumping from “healthy” to “failed,” the simulator exposes the timeline in between.
- You can pause the scenario.
- You can step backward and forward, or scrub to any moment on the timeline.
- You can inspect brokers, partitions, replicas, producers, consumers, offsets, ISR, the high watermark, and metrics.
- You can open the Why tab and read a plain-language explanation of the current state.
- You can open the Metrics tab and see which Kafka metrics move in that situation.
This is especially useful for teaching failure behavior. In a real Kafka cluster, a failure is noisy, concurrent, and often hard to isolate. In the simulator, the same failure becomes a controlled learning moment.
You can ask: “Why did this produce request fail?”
- Then step one event backward.
- Then one event forward.
- Then inspect the ISR.
- Then check the high watermark.
- Then compare the producer configuration with the current replica state.
The point is not only to show the final result. The point is to make the path to that result understandable.
The canonical example: acks=all and min.insync.replicas
One of the simplest and most useful walkthroughs is also one of the best teaching examples. It is the canonical demo on the simulator’s home page, and you can reproduce it hands-on in a free-play sandbox.
Start with:
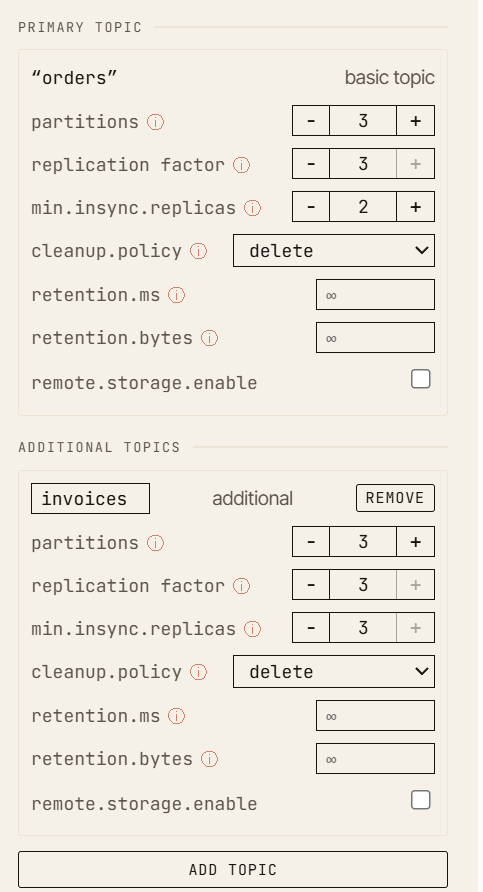
- replication factor:
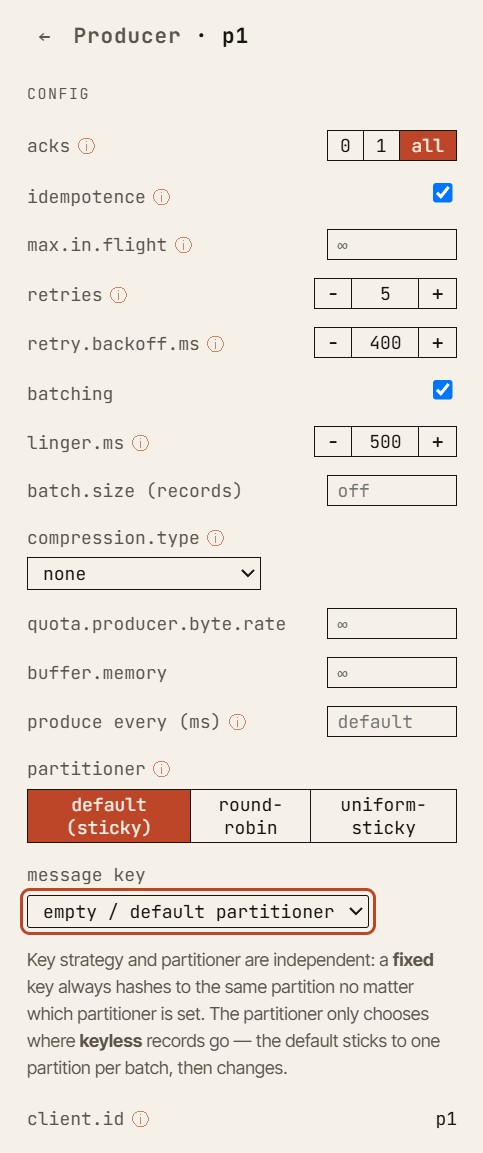
3 min.insync.replicas:2- producer
acks:all
In a healthy cluster, the producer writes to the leader, followers replicate the record, the high watermark advances, and the record becomes committed.
Now kill one broker.
The cluster is degraded, but still writable. There are still two in-sync replicas, so the producer can satisfy acks=all. This is the important boundary: the system is no longer fully healthy, but it can still preserve the configured durability guarantee.
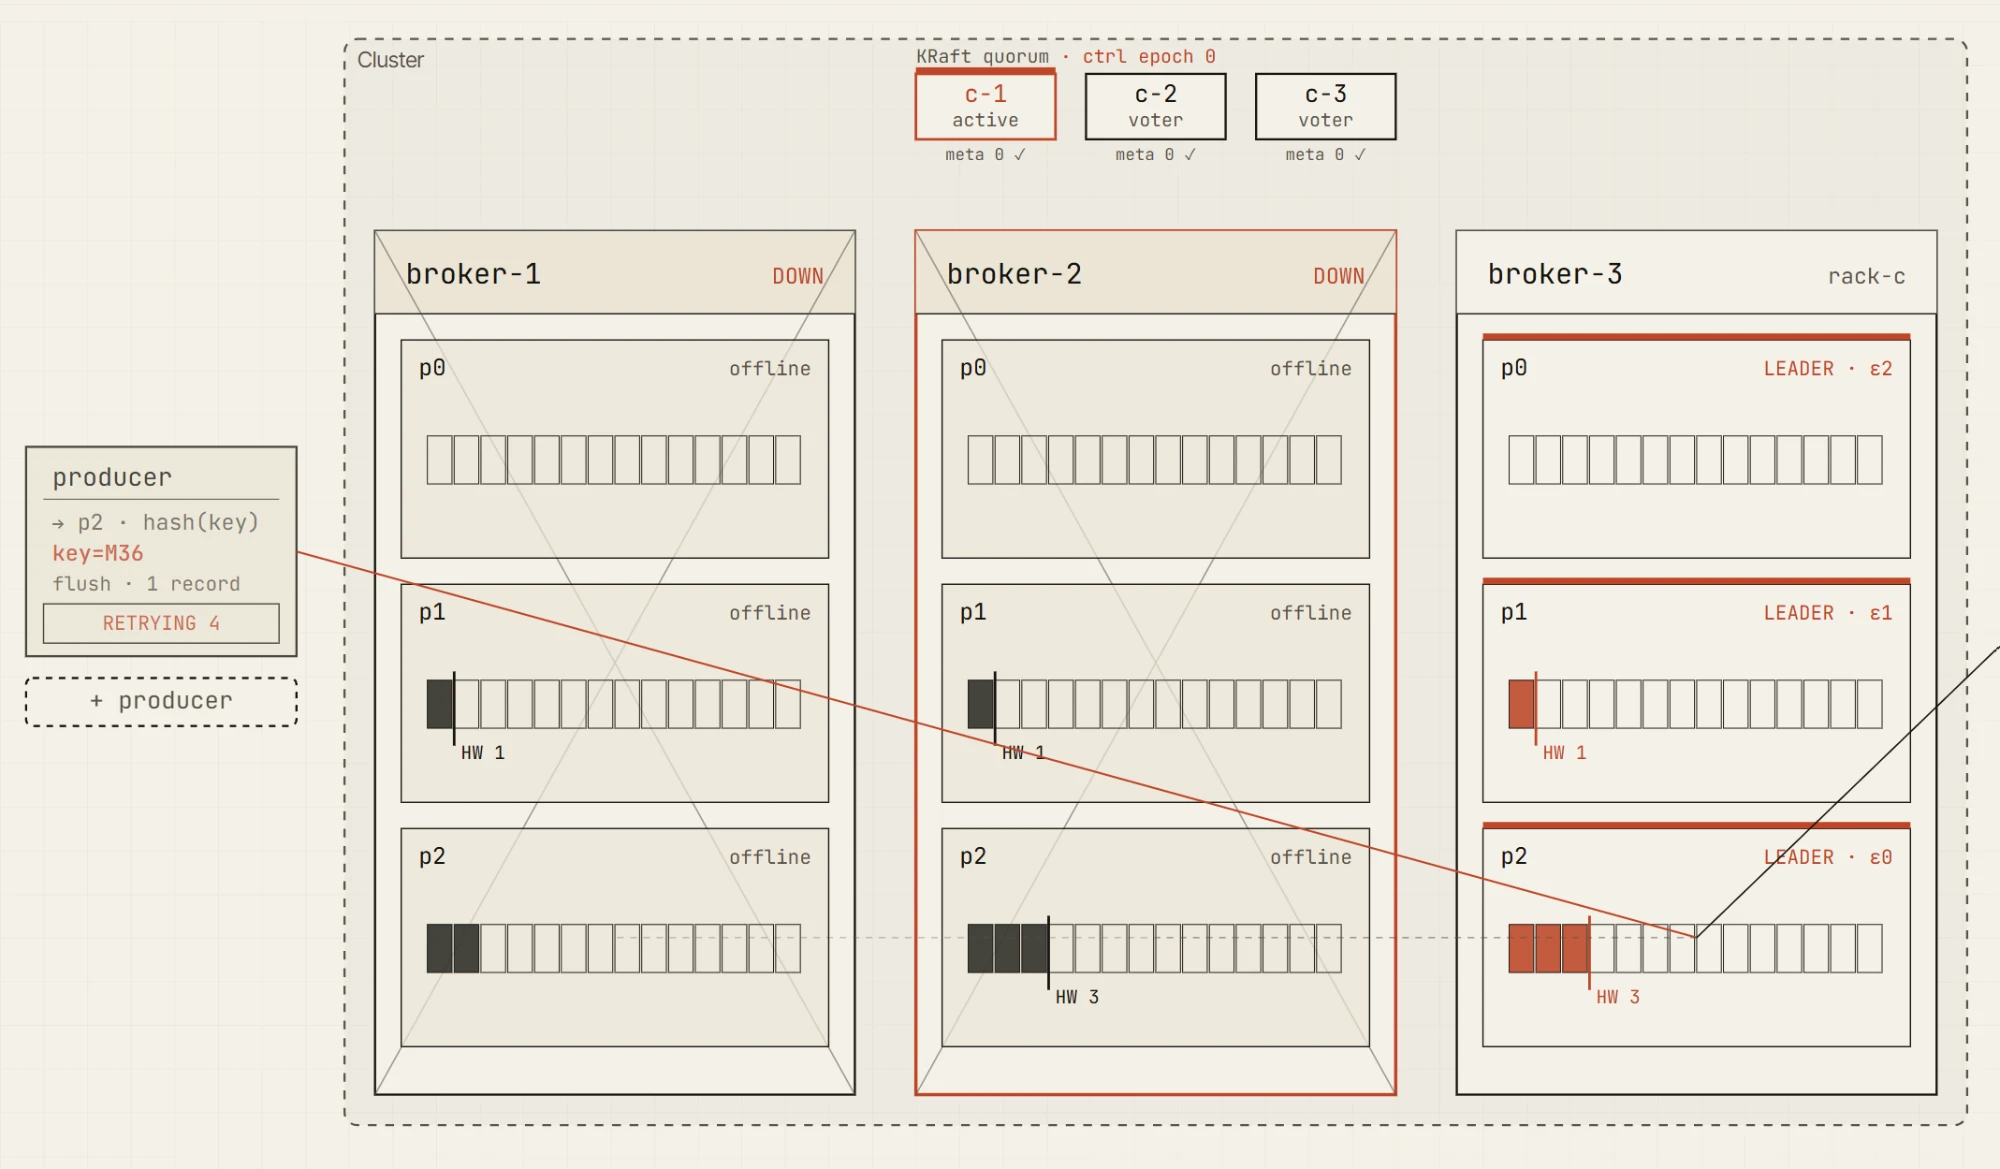
Now kill another broker.
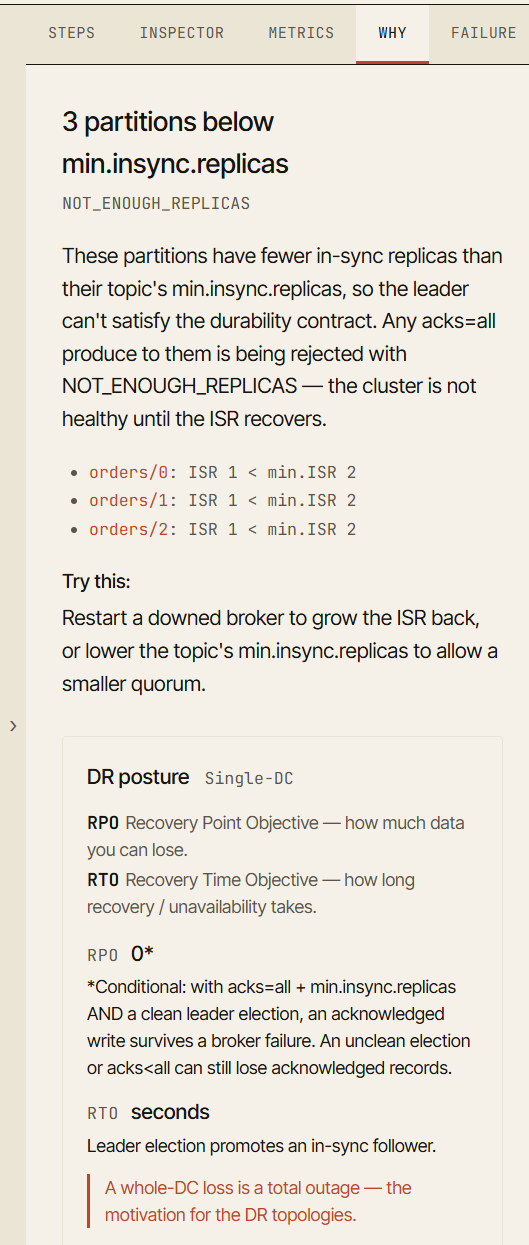
Only one in-sync replica remains. The leader may still be alive, but the producer can no longer satisfy min.insync.replicas=2. The write fails with NotEnoughReplicas.
That distinction is one of the core lessons of Kafka reliability.
A cluster can be available. A leader can exist. A topic can still have data. But writes may still be rejected because the durability contract cannot be met.
This is exactly the kind of concept that becomes much easier when you can see the ISR, leader, producer request, high watermark, and metric changes together on one screen.
Built for step-by-step learning
Each scenario in the simulator is designed as a navigable sandbox.
You are not watching a fixed animation that disappears after it plays. You can move through the scenario like a debugger.
Every event is part of a deterministic, seeded timeline. You can replay it, pause it, step forward, step backward, and inspect state at each moment. This makes it useful not only for demos, but also for workshops, onboarding, debugging discussions, and architecture reviews.
The full scenario state is encoded in the URL: the scenario, the cluster configuration, every action you took, the seed, and the position on the timeline. That means a scenario can be shared as a reproducible link — same configuration, same seed, same timeline, same failure moment.
This makes the simulator useful for explanations such as:
“Open this link and go to the moment where broker 2 dies.”
“Now check the ISR.”
“Now move one step forward and watch the leader election.”
“Now look at the producer error.”
“Now compare that with the metric movement.”
Instead of describing Kafka behavior from memory, you can point to a concrete, inspectable state.
What ships in the first 1.0 release
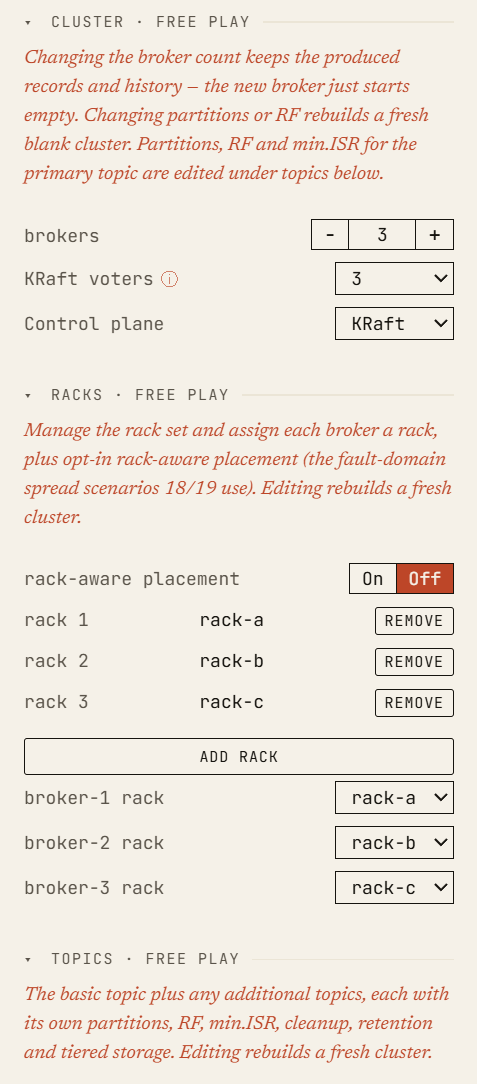
For the first 1.0 release, we are starting with a focused, single-DC version of the simulator, themed Fundamentals.
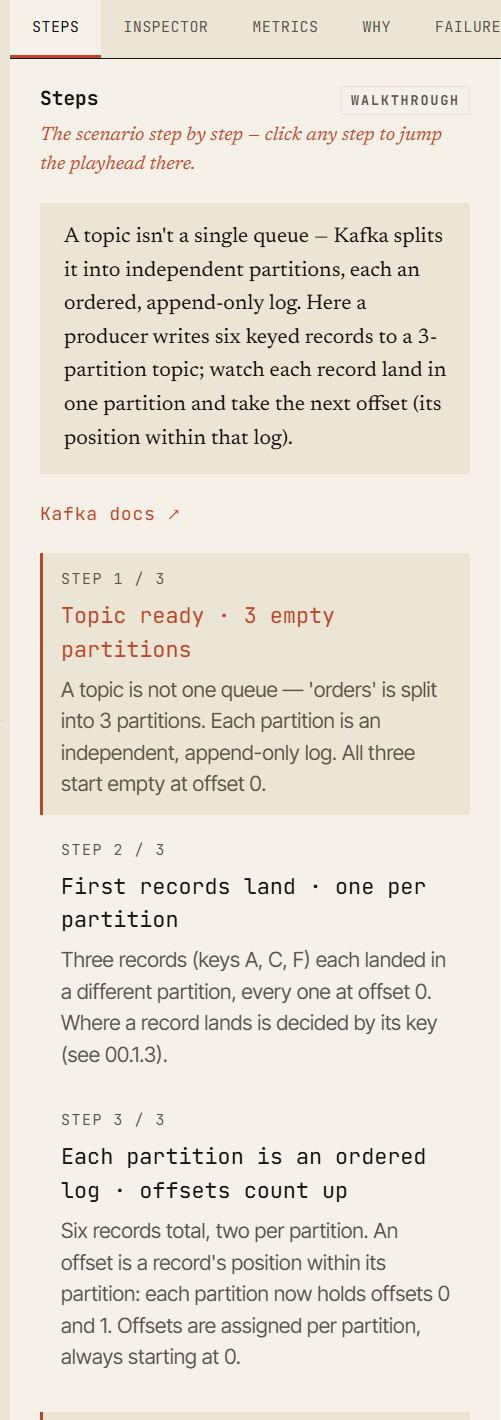
This release concentrates on foundational Kafka learning: topics, partitions, offsets, keys and partitioning, brokers, replicas and leaders, the difference between the log end offset and the high watermark, producer acknowledgements (acks=0, acks=1, the acks trade-off, and the acks=1 durability gap), the consumer fetch loop, partition assignment across group members, and rebalances.
It ships as thirteen guided scenarios, each with a frozen golden trace, plus a free-play sandbox where you can build your own single-DC cluster and experiment — including the acks=all durability walkthrough above.
The goal of the first release is not to expose every scenario we have internally. The goal is to ship a stable, understandable playground that teaches the core mechanics well.
That means the first public version is intentionally smaller than the simulator engine behind it. We would rather release a reliable set of scenarios that explain Kafka clearly than publish every advanced mode before the explanations, edge cases, and visual states are ready.
What is coming next
The simulator engine already models far more than the first pack exposes, and new scenario packs land on a roughly biweekly cadence. The changelog tracks what has shipped and what is next.
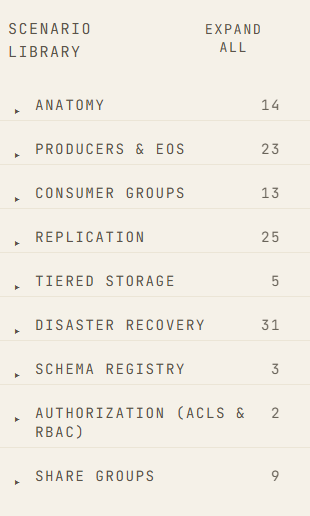
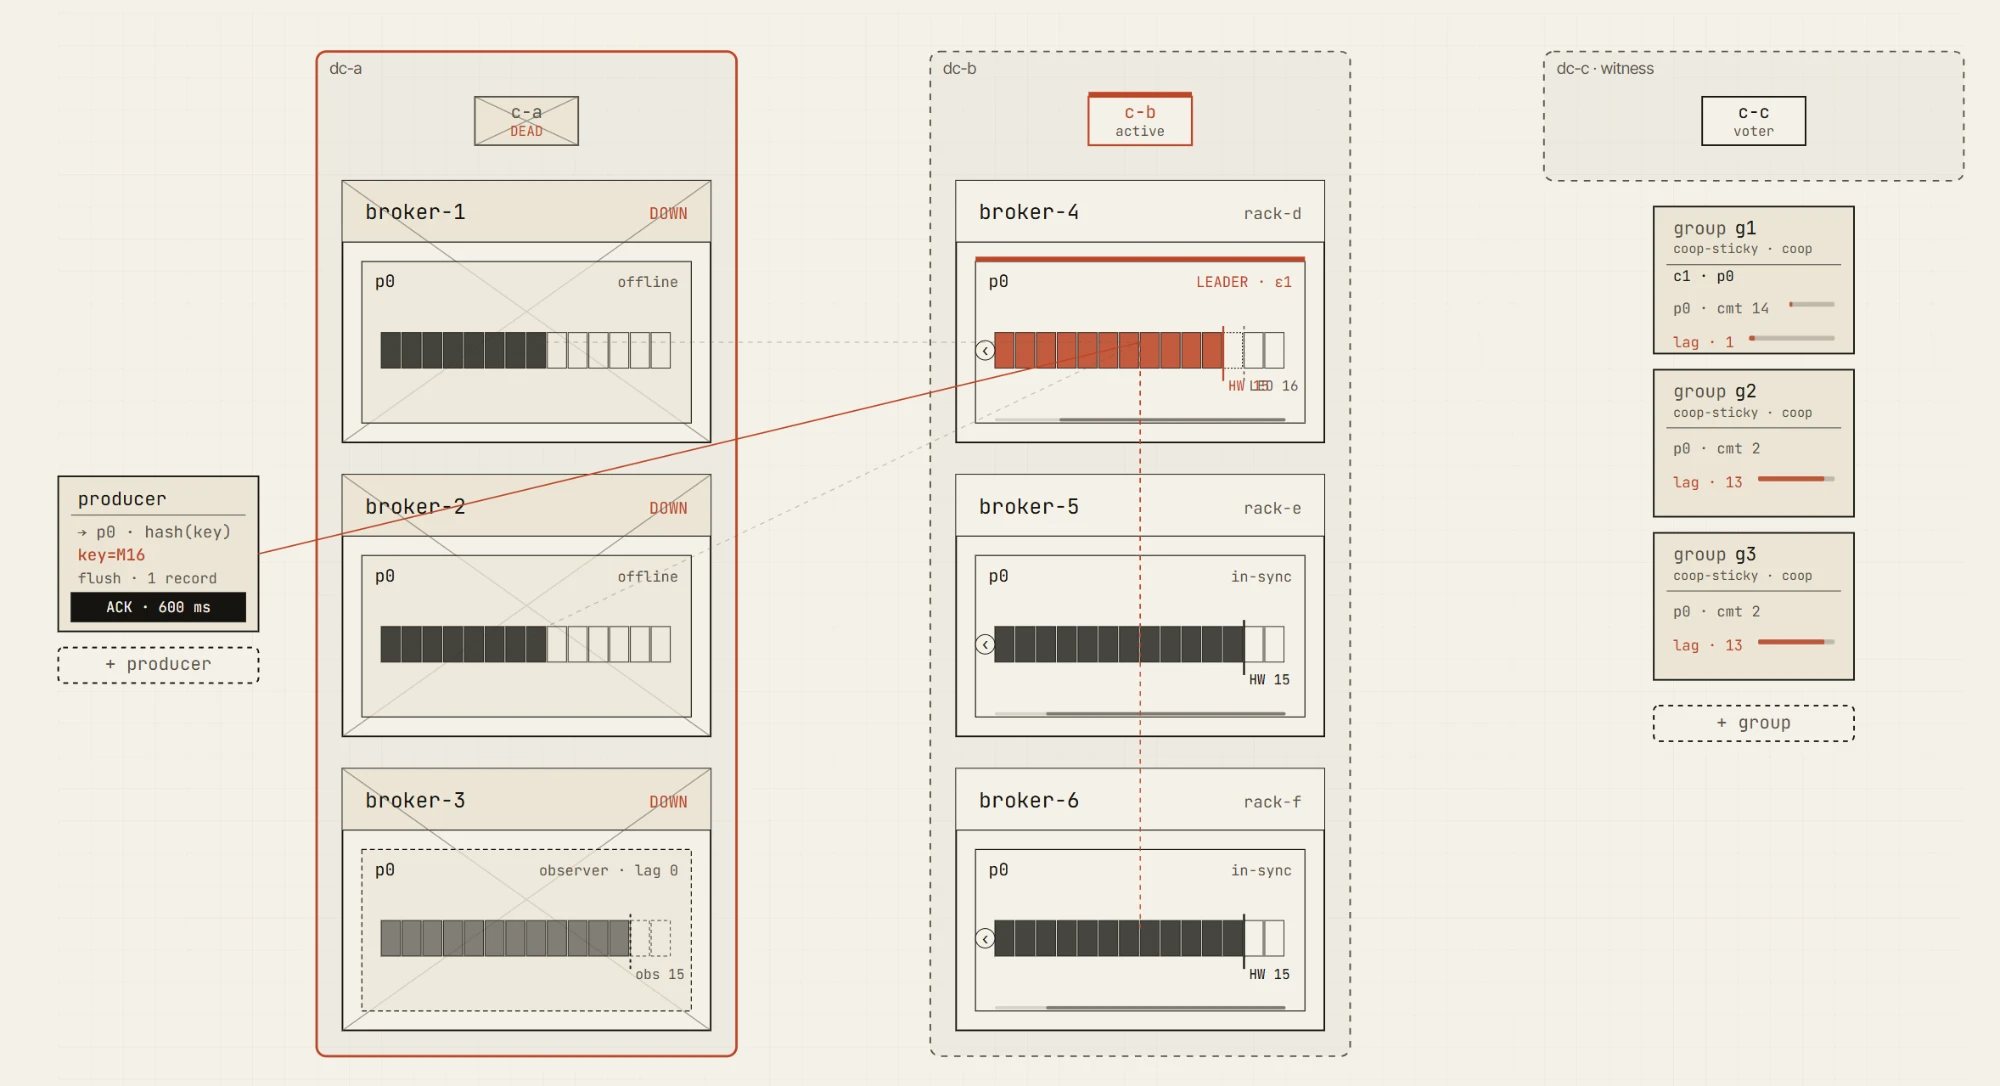
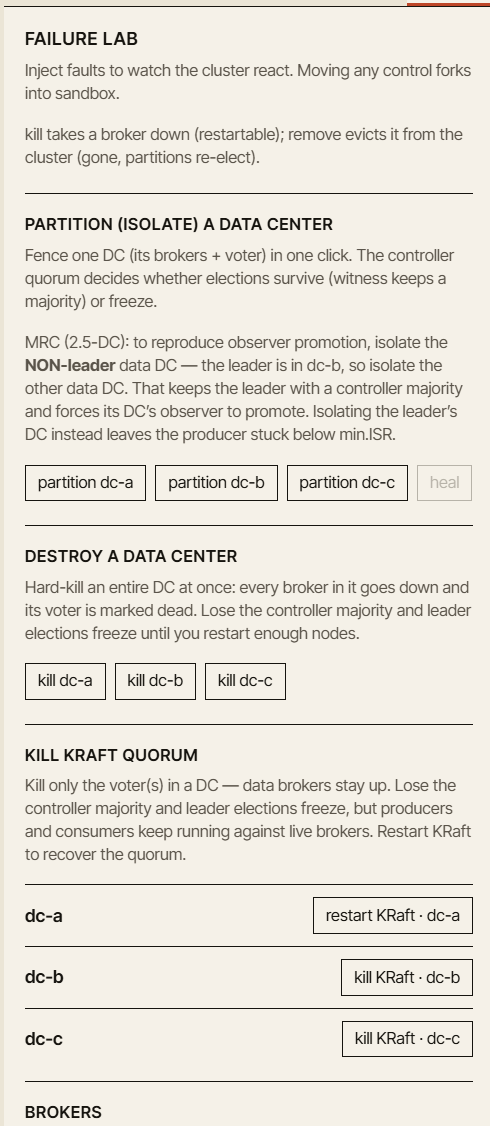
Upcoming packs add guided scenarios for replication and the min.insync.replicas boundary, delivery semantics and transactions, storage and lifecycle, the controller and quotas, a chaos and failure lab, and multi-DC disaster recovery — active-passive, active-active, stretched 3-DC and 2.5-DC clusters, DC failover, observer promotion, network partitions, slow brokers, and unclean leader elections.
These scenarios are powerful, but they also need to be handled carefully. Multi-DC Kafka behavior is full of trade-offs. It is easy to create a demo that looks impressive but teaches the wrong lesson. We want the advanced scenarios to be solid, explainable, and honest about the assumptions they make — which is why they roll out gradually rather than all at once.
Failure modes we want to make understandable
Kafka reliability is not one feature. It is a set of trade-offs.
The simulator is designed to help explain those trade-offs through concrete failure modes:
- broker failures
- slow followers
- network partitions
- ISR shrinkage
- leader elections
- unclean leader elections
- producer retry behavior
- consumer position and lag
- DC failover
- observer promotion
- replication lag
- recovery after failure
A few of these are already explorable in the first release — consumer position and lag, the acks=1 durability gap, and hands-on broker failures in the free-play sandbox. The rest arrive with the chaos and multi-DC packs.
The important part is that each failure should answer the same teaching questions:
- What changed?
- Why did it change?
- What is still safe?
- What is no longer guaranteed?
- Which metric should tell you that something is wrong?
A good simulator should not only show red icons. It should explain the system state behind them.
The Why tab
One of the most important parts of the simulator is the Why tab.
When a scenario reaches an interesting state, the simulator explains why the cluster is behaving that way.
For example, after a broker failure, the visualization may show that a producer is still able to write. The Why tab explains that the ISR still contains enough replicas to satisfy min.insync.replicas.
After a second failure, the producer may start receiving NotEnoughReplicas. The Why tab explains that acks=all requires the configured minimum number of in-sync replicas, and the current ISR is now too small. It also points you straight to the partition or broker that caused it.
This turns a failure from a visual event into a learning event.
The goal is not just to say “this failed.” The goal is to say “this failed because this guarantee could no longer be satisfied.”
Metrics should tell the same story
The simulator also includes a Metrics tab, because Kafka problems are usually diagnosed through metrics in production.
When a follower falls behind, you see it in the ISR-health and under-replicated-partitions readings. When acks=all writes start to retry, the retry count moves and produce throughput drops. When the cluster recovers, those readings settle again. Each metric links back to the event that last moved it, so you can connect a number to the moment it changed.
The metric values in the simulator are educational, not a replacement for production measurement. They are meant to be directionally correct and tied to the scenario state, so learners can connect what they see in the cluster with the kind of signals they would monitor in a real environment.
This matters because Kafka learning often separates architecture from operations. The simulator tries to connect them again.
A broker failure is not only a broker icon turning red. It is also ISR shrinkage, under-replicated partitions, possible leader election, producer behavior changes, and metric movement.
Honest simulation, not magic
We want the simulator to be useful, but we also want it to be honest.
It does not run a real Kafka cluster in the browser. It does not simulate operating system scheduling, disk I/O, page cache behavior, GC pauses, real network buffers, TLS handshakes, or byte-exact serialization.
It is a deterministic, educational model of Kafka behavior. It is built to explain ordering, state transitions, failure consequences, and configuration trade-offs. It is not built to predict exact throughput, latency, or production performance.
That distinction matters. A simulator is valuable when it helps you build the right mental model. It becomes dangerous when it pretends to be more exact than it is.
So the simulator includes an explicit model-limitations page. It explains what is modeled, what is approximated, and what is skipped.
Help us make it better
We also created a public repository for reporting bugs and incorrect behavior.
That matters because Kafka is full of edge cases, and simulation bugs are teaching bugs. If a scenario presents the wrong explanation, the wrong state transition, or the wrong failure outcome, we want to know.
The simulator will improve fastest with feedback from people who use Kafka in different ways: platform teams, developers, SREs, trainers, consultants, and anyone who has ever had to explain why a Kafka cluster behaved differently than expected.
If something looks wrong, please report it.
Start with the single-DC playground
The first release is a foundation: a browser-based Kafka simulator focused on single-DC learning. It is designed for safe experimentation. No backend is required. No real cluster is needed. You can break things freely, replay scenarios, share URLs, and inspect every step.
Multi-DC and disaster-recovery scenarios are coming next, including active-passive, active-active, stretched 3-DC, stretched 2.5-DC, DC failover, and observer promotion.
For now, start with the basics. Open the playground, start a single-DC free-play cluster, and:
Set replication.factor=3.
Set min.insync.replicas=2.
Set acks=all.
Kill a broker.
Then kill another one.
Kafka is easier to understand when you can see it move.
It is even easier when you can break it safely.